
In part 2 of our Groundworks Series on ‘Preparation, Not Panic’, we’re covering the importance of data-led decision making and how it helps proof your business from bias.
What is data-led decision making?
Instead of making choices on a whim or taking your business in a direction based on personal experiences alone, consider data-led decision making. Data allows you to see the facts about what is happening and is not based on opinion or perception. It’s also important to follow the data when preparing for or reacting to a crisis.
Examples of data-led decision making
Google Trends is an easily accessible example you can try yourself. We explored the trend of Google search data for the term “big data”. Personally, you might never have heard of it or understand what it really means. But this doesn’t mean that no one is talking about it. Check out this graph that shows interest over time since 2004. Notice that interest skyrocketed from 2011 to 2016.
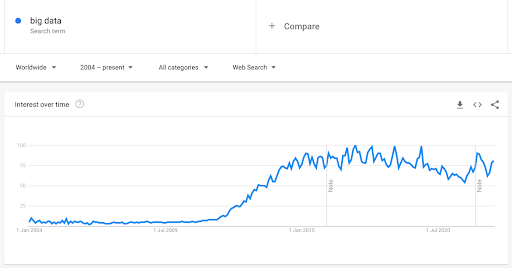
If you weren’t clued into big data at the time, you might not have noticed these increased searches going on in the background, because they’re beyond your personal sphere influence.
Looking at this data helps you make informed decisions that aren’t affected by yours or someone else’s bias. Another example could be the colour of a [Buy Now] button on a website. You might think a red button looks nice but your colleague thinks blue would work best. With data-led decision making, you can put this to the test. A/B testing will test both options and the data received will inform you which colour actually works best.
A real-life example of this is the case of The 300 Million Dollar Button where simply changing one button based on data increased annual revenue by $300M.
Interpreting your data for decision making
Whilst data is factual and concrete, it can be difficult to interpret. It can also be manipulated incorrectly into presenting misleading or confusing information. This is why we advise that you clarify what it is you want to know first and then use the data to work this out.
“Think of data as an ingredient and what you want to know as your pie. Decide what pie you want to make first, then buy the ingredients.” – Lawrence Alexander, Strategy & Innovation Director at DS.Emotion.
When it comes to analysing your data, three is the magic number. You need at least three data points in order to be able to obtain an average.
For example, let’s say you’ve decided to look at website visitors. If you look at visitor data across February and March only to discover the figures are vastly different, how do you know which month is normal and which is the outlier? By looking at January as well, you can begin to determine what the average is.
Want more insights tailored to your individual needs? Sign up for a free workshop.
With clients across the property and place industry, DS.Emotion are uniquely positioned to offer valuable and actionable insights. We encounter scenarios relating to ESG, supply, placemaking and support and therefore see the trends and troubles that pose issues for everyone.
With this in mind, we’ve launched a new service that’s free to all of our clients. Benefit from a free 2-hour workshop* where our strategy team will sit down with you and help you tackle the issues affecting almost everyone in the industry. Then, we’ll share our findings, unique to you, to help get them under control. It’s a great way to get ahead of the game and it’s completely free.
Workshop topics this year include:
- Simplifying marketing strategy
- Data-led decision making [the subject of this article]
- Being agile without being reactive
- Keeping it consistent
- Seasonal preparation
Interested? Simply let us know some times that work for you and we’ll do the rest.